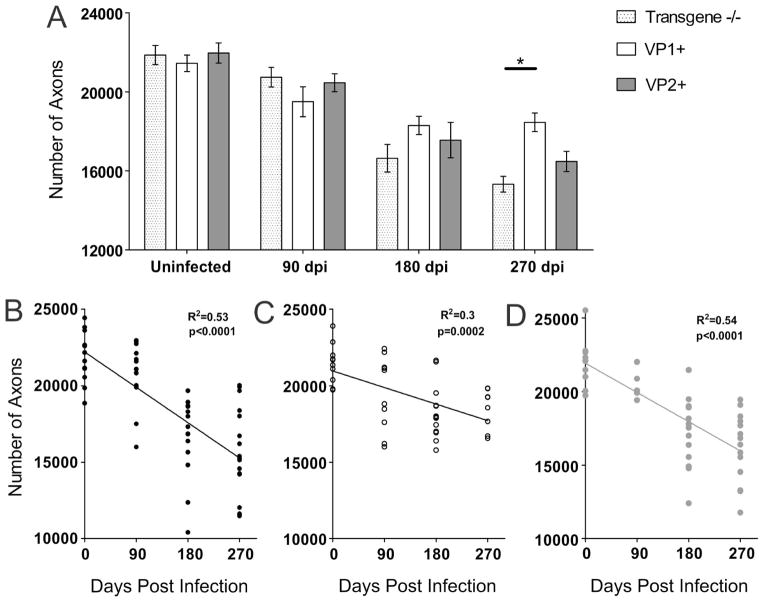
Figure 4. Mid-thoracic (T6) axons quantitation.
Axons were counted in 6 areas of a mid-thoracic spinal cord section, as described in the methods. (A) The total number of myelinated mid-thoracic (T6) axons in mice from all three strains prior to infection and at 90 and 180 dpi was similar. At 270 dpi, VP1+ animals had significantly more axons than transgene negative mice (p=0.02, ANOVA). Bars represent the means of the group with standard error of the mean. (B–D) When the total number of axons from all transgene negative (B), VP1+ (C) and VP2+ mice (D) was plotted against time point post-infection negative and statistically significant correlations were observed. Note the steeper slopes in transgene negative and VP2+ mice as a result of overall greater axonal loss in these strains.

