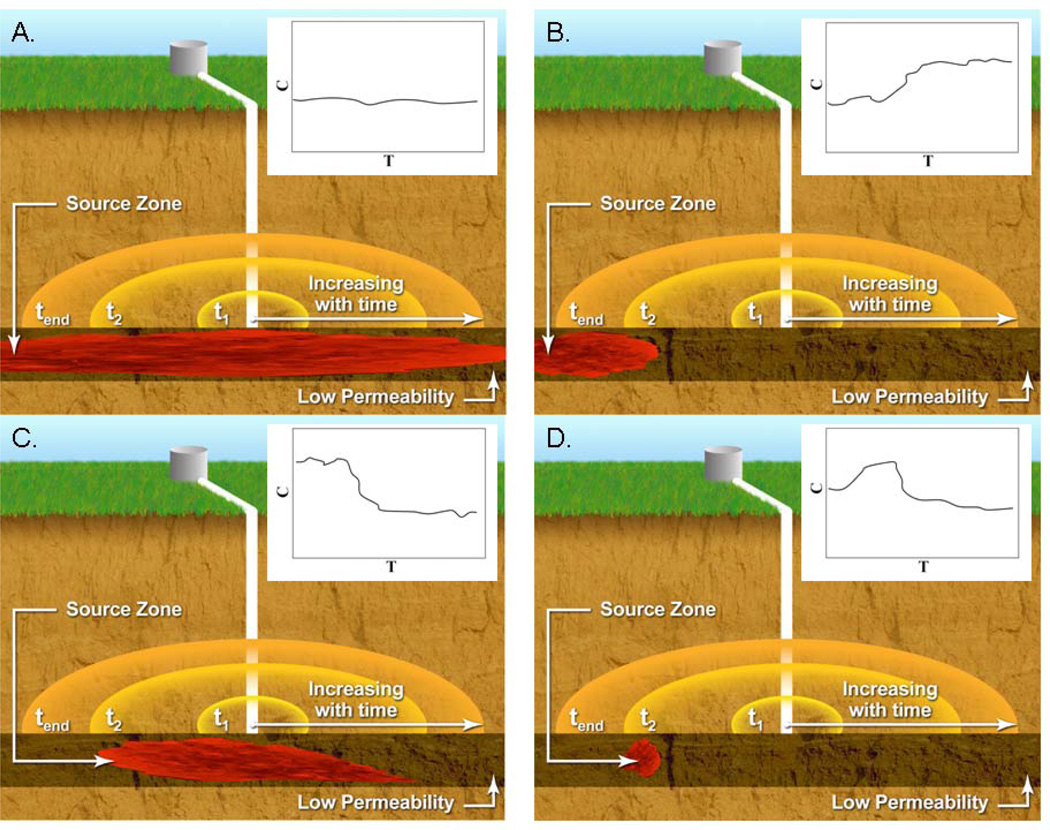
Figure 7.
Illustrative cross-sectional diagrams of a hypothetical well’s swept volume, as radial distance from the extraction well, at a few elapsed times (tend equals end of test) in relation to the location of a source. Inset plots contain concentration (C) versus time (T) responses for each associated scenario. From Carroll et al. (2013).

