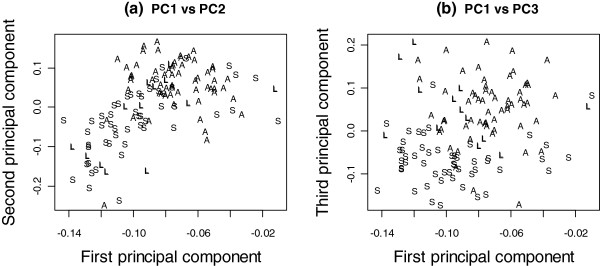
Figure 3.

Principal component plots of the mRNA data. The first and second principal component plot (left) and the first and third principal component plot (right) of the mRNA data revealed the separation of squamous-cell carcinoma (S) from the adeno-carcinoma (A) and large-cell carcinoma (L).
