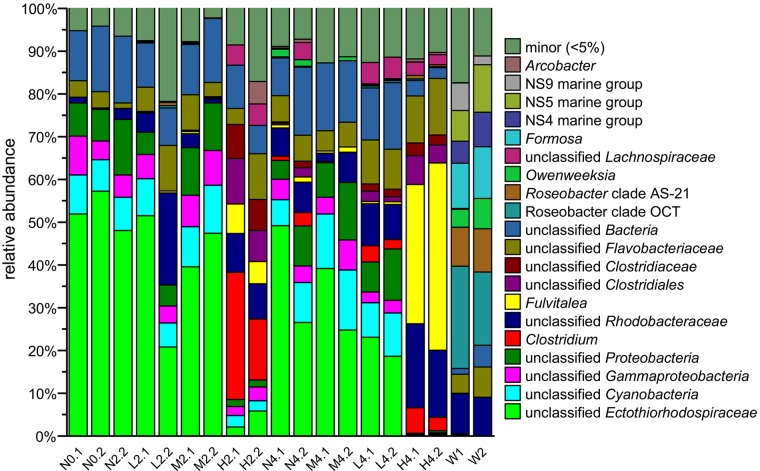
FIG 2 .
The bacterial community composition at the genus level of sponge samples treated with copper, controls, and seawater samples. The y axis indicates the relative abundance of taxa, and the x axis indicates samples. The letters N, L, M, and H refer to sponge samples from the negative-control and low-, medium-, and high-dose treatments, respectively. The numbers 0, 2, and 4 indicate 0, 2, and 4 days of treatment, respectively, and the numbers after the dots are replicate numbers. W1 and W2 are two replicates of the seawater sample.

