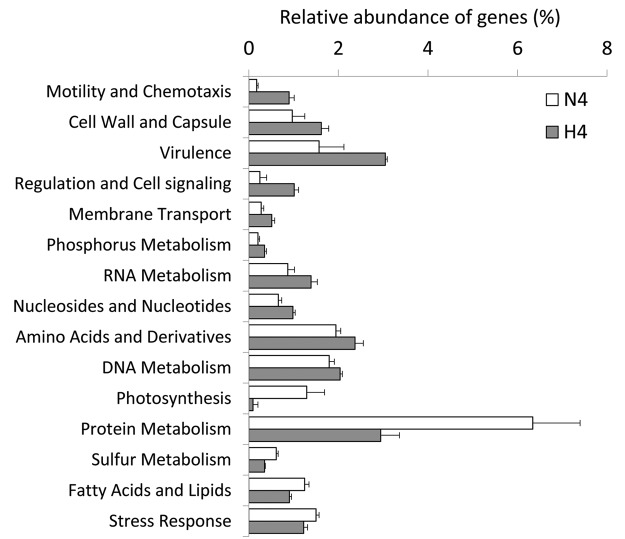
FIG 3 .
Functional genes with significant relative abundances (t test, P < 0.05) changed (decreased or enriched) in response to copper treatment. N4 denotes negative-control samples, and H4 indicates high-dose-treated samples. The x axis shows the normalized relative abundance of genes (as a percentage), and the y axis shows the functional categories at the first level of the SEED classification system.

