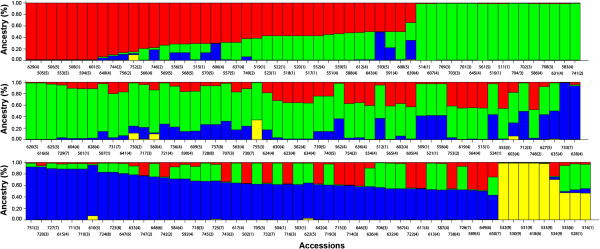
Figure 2.

Population structure of Vitis germplasm collection as estimated with STRUCTURE software. Each accession is represented by a vertical histogram portioned into K = 4 colored segments that represent the estimated membership of each individual genotype. Accessions were ordered by inferred clusters and identified by a the accession number and a number between brackets that corresponds to the cultivation area, i.e. local cultivars (1), certified cultivars from Portugal (2), Spain (3), Italy (4), Central Europe (5), Eastern Europe (6), Balkan Peninsula (7), Near East (8) and wild Vitis species (9) (see also Additional file 2 for details on single subgroups and inferred clusters).
