Figure 3.
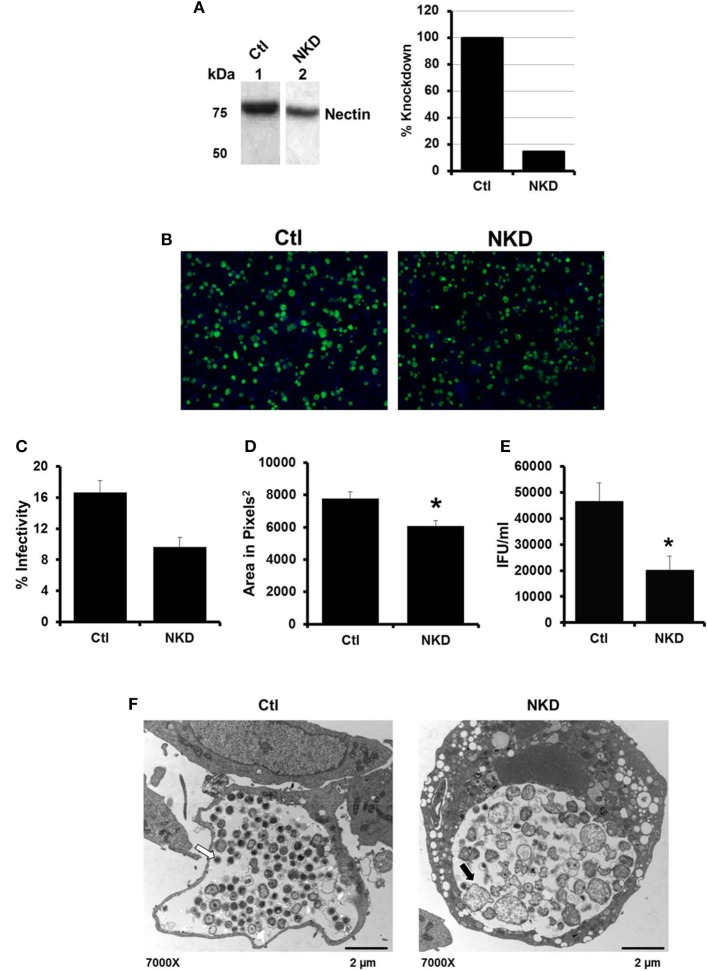
Production of C. trachomatis infectious progeny, but not inclusion formation, is nectin-1 dependent. (A) Nectin-1 accumulation in control (Ctl, lane 1) and nectin-1 knockdown (NKD, lane 2) cell lines was verified by Western blot analysis. Intensity was normalized to total protein intensity detected by SYPRO Ruby staining (data not shown) and analyzed with Gene Tools software (Syngene). Intensity measurements are shown as percent of Ctl. (B–F) Replicate cultures of Ctl and NKD cells were infected with CtE and harvested at 48 hpi for various analyses. (B) Chlamydial inclusions were stained with Pathfinder anti-chlamydial stain (green). Cell nuclei were counterstained with DAPI (blue). Images were captured at 100 × magnification on a Ziess Axiovert S100 microscope. (C) Percent infectivity was calculated by counting the number of inclusions/cell nuclei in 10 random fields per coverslip from triplicate samples. (D) Area of 32 random inclusions per triplicate samples was measured using Ziess Axiovision software. (E) The production of infectious EB in CtE-infected Ctl and NKD was determined by titration analysis. (C–E) Results are expressed as the mean ±s.e.m. of three biological replicates. Significant (P ≤ 0.05) difference from CtE-infected Ctl cells is indicated by the asterisk (*). (F) CtE-infected Ctl and NKD cultures were analyzed by TEM. White arrows on electron micrographs indicate EBs and black arrow indicate ABs.

