
Fig. 7.
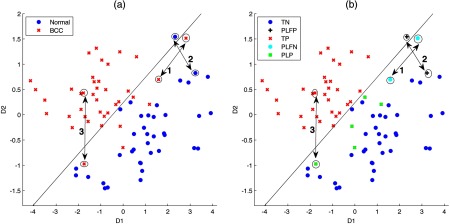
PC scores (D1 and D2) for classifying BCC versus normal (N) using per measurement analysis (a) versus per lesion analysis (b). For better visualization, this plot zooms at the region around the decision line. Legends: TN = true negative (normal skin measurements on the negative side of the decision line), PLFP = per lesion false positive (normal skin measurements with at least one measurement on the positive side of the decision line), TP = true positive (BCC measurements on the positive side of the measurements), PLFN = per lesion false negative (all measurements from the same BCC lesion located on the negative side of the decision line), and PLP = per lesion positive (BCC measurements that have a corresponding lesion measurement on the positive side of the decision line).