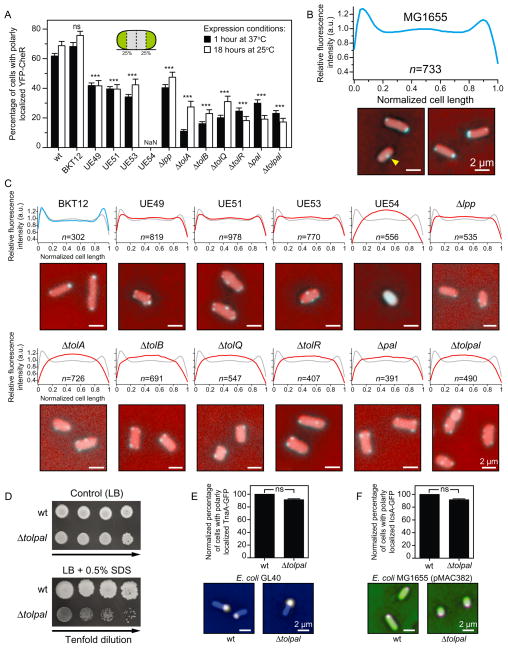
Fig. 2. Subcellular localization of chemoreceptors and other membrane-associated proteins in wild-type (wt) E. coli MG1655 and in various isogenic mutant strains.
A. Per cent of E. coli MG1655 cells and various isogenic mutants with polarly (unipolar or bipolar) localized YFP–CheR imaged after 1 h at 37°C (black bars) and after 18 h at 25°C (white bars). Inset image: A cartoon depicting the poles as the outmost quartiles of cells (coloured in green). Here and elsewhere, cells were determined to display a ‘wild-type phenotype’ if all the clusters were located within the first and/or fourth quartiles of the cell. Otherwise, cells were labelled as displaying ‘non-wild-type phenotype’. NaN, no polar clusters were detected.
B. Fluorescence intensity profile of the subcellular distribution of YFP–CheR in wild-type E. coli MG1655 cells (n = 733) imaged after 1 h at 37°C (a.u., arbitrary units). Panel below the graph: Representative fluorescence microscopy images depicting the localization pattern of YFP–CheR in wt E. coli MG1655 cells. Microscopy images are representative of three independent experiments performed on different days. The yellow arrowhead indicates the YFP–CheR foci at mid-cell. Scale bars = 2 μm.
C. Fluorescence intensity profile of the subcellular distribution of YFP–CheR in isogenic mutants of E. coli MG1655 imaged after 1 h at 37°C (a.u., arbitrary units). We superimposed the YFP–CheR fluorescence profile of the wild-type cells (in grey) on top of the profile of the isogenic mutants (in blue or red). Panel below each graph: Representative fluorescence microscopy images depicting the localization pattern of YFP–CheR in isogenic mutants. Images are representative of at least three independent experiments performed on different days. Scale bars = 2 μm.
D. Growth assay of serial dilutions (left to right) of wt E. coli MG1655 and E. coli MG1655 Δtolpal. Aliquots of 10-fold serial dilutions (5 μl, 101–104 cfu ml−1) from overnight cultures were spotted on control agar (LB) and agar containing 0.5% SDS. The plates were incubated at 37°C for 24 h and then at 25°C for additional 24 h.
E. Per cent of E. coli MG1655 (n = 464) and E. coli MG1655 Δtolpal (n = 386) cells with polarly localized TnaA–GFP. Panel below the graph: Representative images obtained in at least three independent experiments performed on different days.
F. Per cent of E. coli MG1655 (n = 601) and in E. coli MG1655 Δtolpal (n = 406) cells with polarly localized IcsA–GFP. Panel below the graph: Representative images obtained in at least three independent experiments performed on different days.
To assess differences between the localization patterns in the various E. coli strains (panels A, E, and F), we performed Chi-squared tests. All tests were two-sided and statistical significance was considered when a P-value < 0.05 was observed. ns, non-significant; *P < 0.05; **P < 0.01; ***P < 0.001 compared to the wild-type phenotype. Error bars indicate the standard error of the mean. Scale bars = 2 μm.

