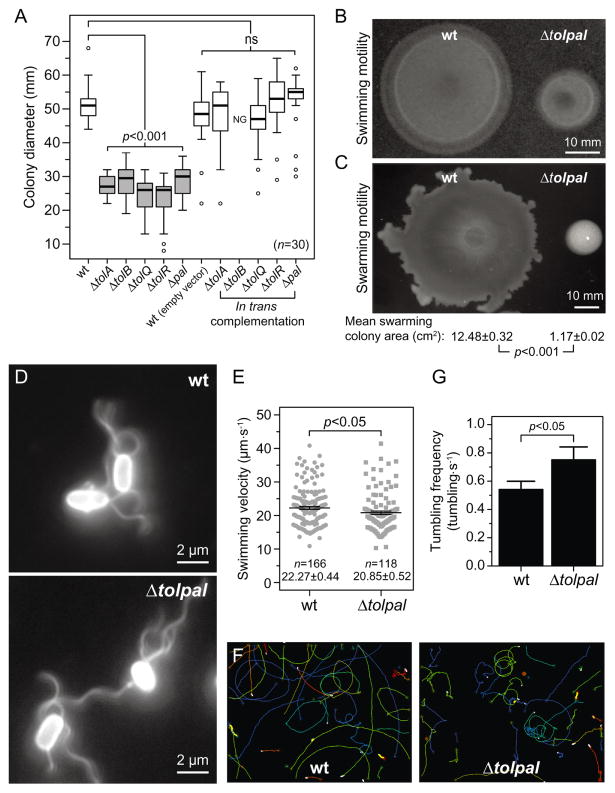
Fig. 3. Motility phenotype and velocity of wild-type (wt) E. coli MG1655 cells and various isogenic mutants.
A. Box-and-whisker plots depicting the size of the migrating colonies (n = 30) measured for each E. coli strain. The extent of the box encompasses the interquartile range of the diameter, whiskers extend to maximum and minimum diameters, and the line within each box represents the median. Outliers are represented as open black circles. Plots represent at least three independent experiments performed on different days. For complementation experiments, 50 μg ml−1 of carbenicillin and 1 mM of IPTG were added to the motility agar. ns, non-significant; NG, no growth. All tests were two-sided and statistical significance was considered when a P-value < 0.05 was observed. Box-and-whisker plots coloured in grey represent migrating colonies that were significantly different (P < 0.001) compared to the wild-type phenotype.
B. Representative image of swimming colonies of wt E. coli MG1655 and E. coli MG1655 Δtolpal after 14.5 h of incubation at 30°C on swimming motility agar. Scale bar = 10 mm.
C. Representative image of swarming colonies of wt E. coli MG1655 and E. coli MG1655 Δtolpal after 16 h on swarming motility agar at 30°C. The area of individual swarming colonies (n = 20) was measured using ImageJ and the mean swarming colony areas were compared using an unpaired Student’s t-test of mean difference = 0. The t-test was two-sided and statistical significance was considered when a P-value < 0.05 was observed. The mean swarming colony area and the standard error of the mean for E. coli MG1655 and E. coli MG1655 Δtolpal, and the correspondent P-value are indicated below the representative image. Scale bar = 10 mm.
D. Representative immunofluorescence images of wt E. coli MG1655 and E. coli MG1655 Δtolpal cells labelled with a polyclonal anti-FliC primary antibody and an Alexa Fluor 488-conjugated secondary antibody. Scale bars = 2 μm.
E. Plot depicting velocity of individual cells (n = 166 for wt E. coli MG1655 and n = 118 for E. coli MG1655 Δtolpal). Error bars indicate the standard error of the mean. The mean velocity and standard error for each population are indicated below each plot. Statistical significance bar is shown and the P-value is the result of an unpaired Student’s t-tests of mean difference = 0. The t-test was two-sided and statistical significance was considered when a P-value < 0.05 was observed. Analyses represent the combination of at least three experiments performed on different days.
F. Representative image of cell trajectories. The images consist of an overlay of three images from two independent experiments performed on different days – each coloured line represents the trajectory of an individual cell.
G. Average swimming reversal rate of wild-type E. coli MG1655 and E. coli MG1655 Δtolpal. We performed an independent sample randomization test with 10 000 simulations of differences of means using the R software. Statistical significance was considered when an approximated P-value < 0.05 was observed.

