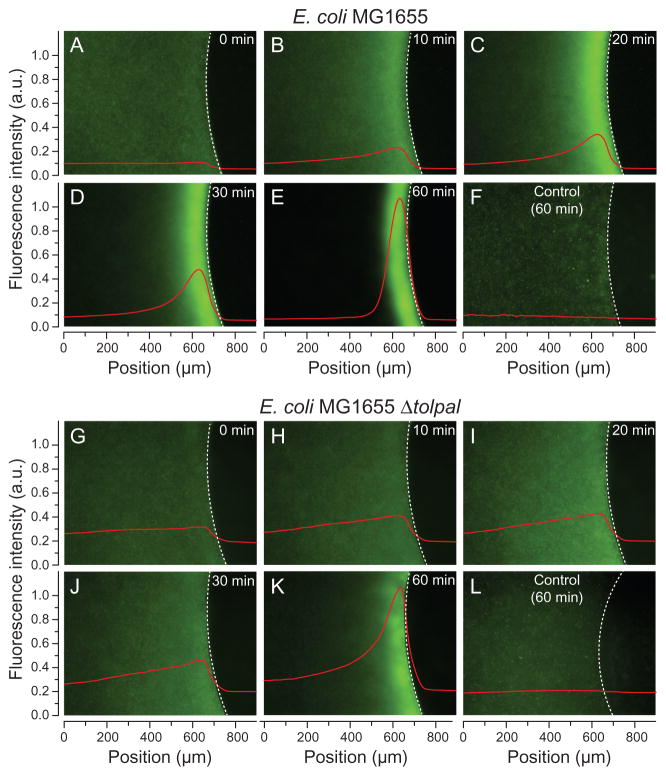
Fig. 4.
Chemotactic response of E. coli cells to L-aspartate using the μPlug assay. Spatial distribution of eGFP-labelled E. coli MG1655 (A–E; F, control) and E. coli MG1655 Δtolpal cells (G–K; L, control) in the presence of 1 mM of L-aspartate. Panels A–E and G–K show a series of representative images obtained from the same time-lapse experiment for each strain. Fluorescence intensity profiles demonstrating the chemotactic response of cells to the μPlug (represented by red lines; a.u., arbitrary units) are overlaid on each image. A dashed white line delineates the agarose plug-liquid interface. We used IGOR Pro (Version 6.22A) to derive the total mean fluorescence intensity profiles along the entire x-axis for each image to visualize cells accumulated at the plug–liquid interface. A moving average was used to smooth the data trend in the series of images. Controls show the distribution of eGFP-labelled cells in the absence of L-aspartate. Images were false-coloured using ImageJ.

