
Figure 1.
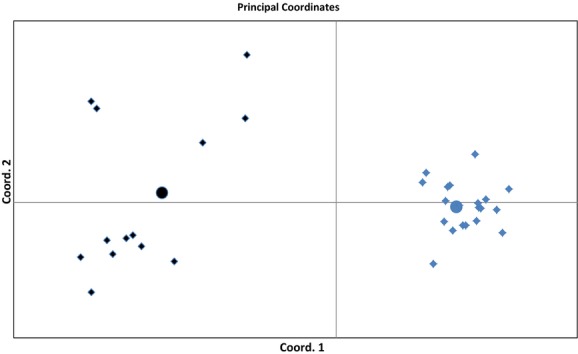
PCoA plot from pairwise FST estimates between farm (black diamonds), wild (blue diamonds) and in silico generated farm (black circle) and wild (blue circle) center points. The first and the second axis explained 55% and 16% of the variation, respectively.