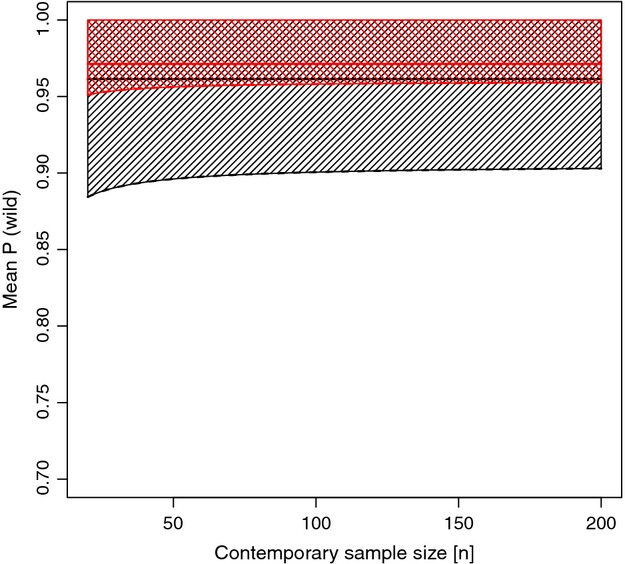
Figure 3.

Acceptance region (shaded area) and critical value (lower, dashed line) for a hypothesis test comparing means from a historical reference sample and a contemporary sample, shown as a function of the contemporary sample size. The alternative hypothesis states that the contemporary sample mean is smaller than the historical reference mean. Black shaded area and line indicates the test without a population-specific historical reference, whereas red shaded area and line the test for one of our populations with a historical reference sample. The straight, solid lines give the means of the wild references.
