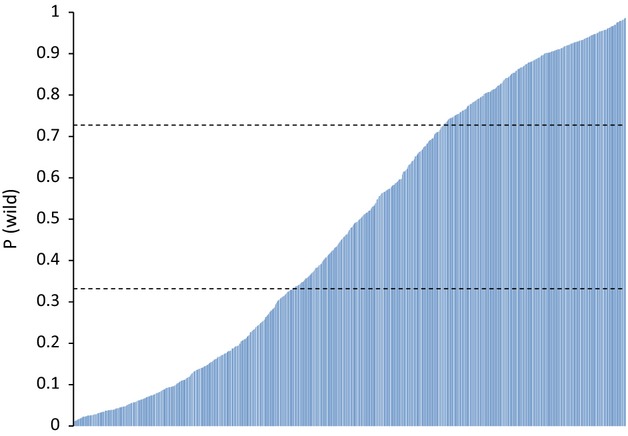
Figure 4.

Distribution of probabilities for belonging to one of two assumed populations (wild and farm) [P(wild)] using STRUCTURE for in silico generated crossing (hybrids) between wild and farm salmon reference samples (Table S1) using real genotype data. Estimates were obtained from analyzing individuals one by one together with wild and farm in silico generated center points. Upper and lower horizontal dashed line is the lower 5 percentile and the upper 95 percentile from the probability distribution from wild and farm references.
