
Figure 4.
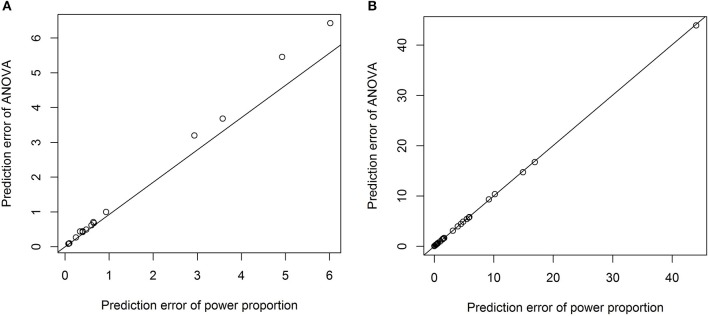
Scatterplots of prediction errors based on the power-proportion method and the ANCOVA method. (A) When the exponent parameter is significantly different from 1; (B) when the exponent parameter is not significantly different from 1.
Official websites use .gov
A
.gov website belongs to an official
government organization in the United States.
Secure .gov websites use HTTPS
A lock (
) or https:// means you've safely
connected to the .gov website. Share sensitive
information only on official, secure websites.
Scatterplots of prediction errors based on the power-proportion method and the ANCOVA method. (A) When the exponent parameter is significantly different from 1; (B) when the exponent parameter is not significantly different from 1.