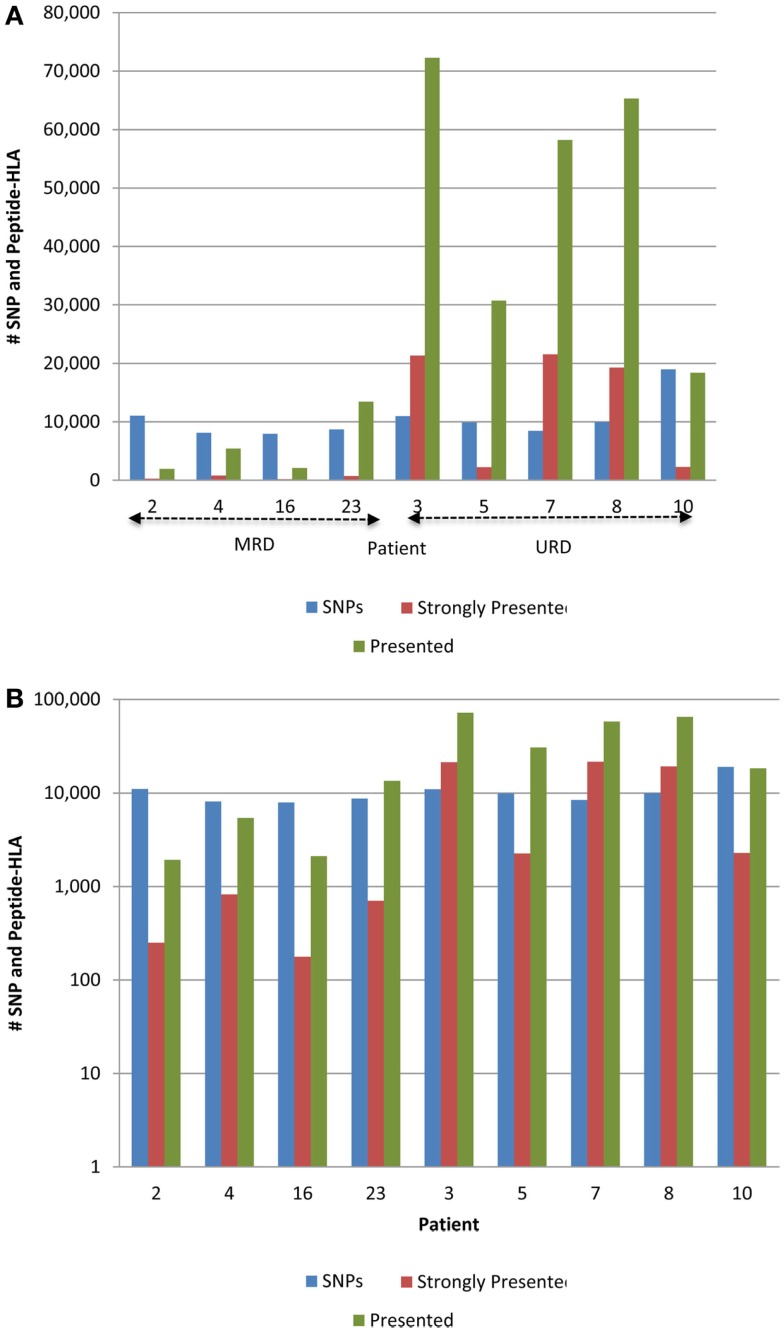
Figure 3.
Whole exome sequence variation and resulting HLA-binding oligopeptides in MRD and URD. (A) Number of nsSNP, and the resulting presented (IC50 < 500 nM) and strongly presented (IC50 < 50 nM) peptides (GVH vector) presented by the HLA in each patient. (B) Same data as in (A), presented with the y-axis changed to log-scale to better illustrate the SNP to HLA-binding peptide ratio between MRD and URD. Significant difference observed in the distribution of SMM-IEDB predicted presented and strongly presented peptides between MRD and URD. Patients 2, 4, 16, 23 – MRD; patients 3, 5, 7, 8, 10 – URD SCT recipients.

