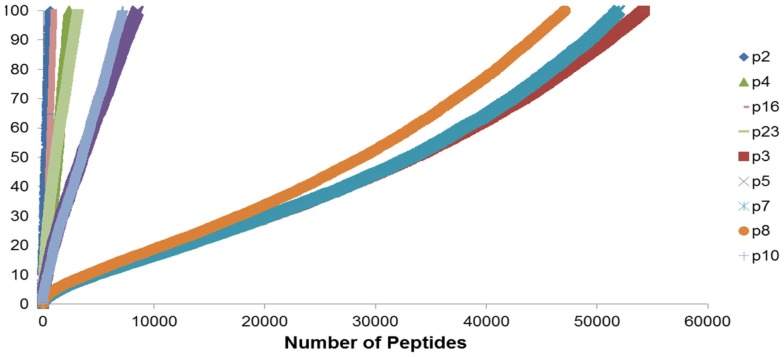
Figure 4.
Peptide-HLA complexes with IC50 values up to 100 nM plotted in descending order of binding affinity. Depicting difference in the number of peptide-HLA complexes (x-axis) and their IC50 values (y-axis), for each DRP. Lower IC50 values correspond to greater binding affinity between putative peptide and relevant HLA. IC50 distribution is non-linear and described as a polynomial function of the second order, forming a continuum. Marked difference observed between MRD and URD (see Table 2) for the AUC calculated from these plots.

