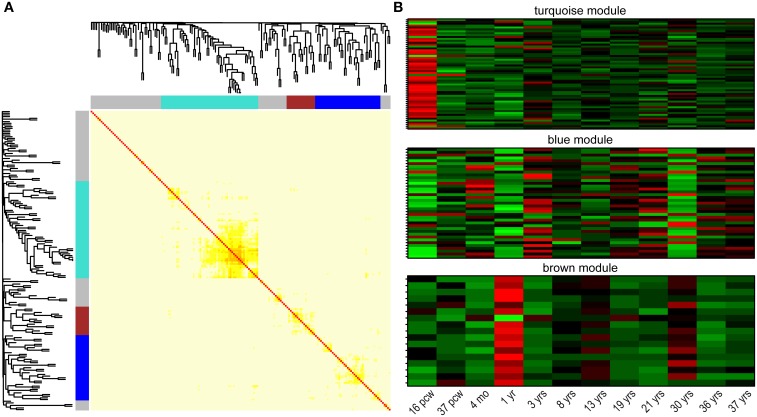
Figure 4.
Co-expression clusters among NHGRI-cross-disorder genes. (A) Topological overlap matrix plot (TOMplot), a heatmap depicting the topological overlap matrix supplemented by hierarchical clustering dendrograms. Modules are depicted in colors (turquoise, blue, and brown). (B) Expression heatmap plots for each module. The following abbreviations are used: postconceptional weeks (pcw), months (mo), years (yrs).

