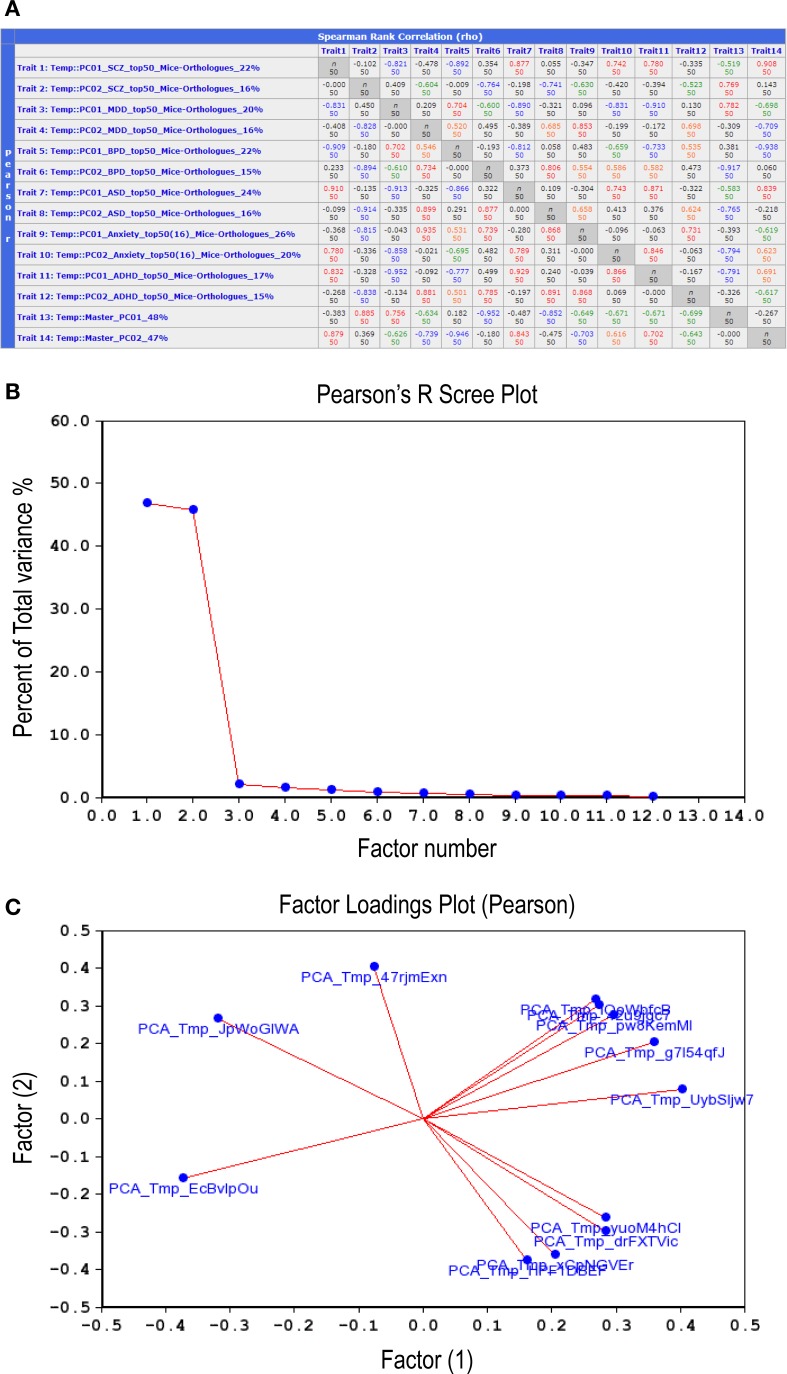
Figure 6.
Correlations between the top-12 synthetic PC traits. (A) Second-order correlations between all 12 synthetic PC traits, two per disorder, are depicted. The number appearing at the end of each trait name (first column) denotes the percent of total variance for each PC generated from a disorder's top-51 gene-set mouse orthologs co-expression vector. The bottom two rows depict the second-order (termed Master) PCs that were generated by correlating the 12 synthetic PC traits amongst themselves. Lower left cells list Pearson product-moment correlations; upper right cells list Spearman rank order correlations. Each cell also contains the n of cases. Values higher than 0.7 are displayed in red; those between 0.7 and 0.5 in orange; between −0.5 and −0.7 in green; values lower than −0.7 are in blue. Scree plot (B) depicts the percentage of total variance across the 12 synthetic PC traits (>45%) that is accounted for by each one of the Master PCs. Factors loading plot (C) depicts the relative vector-wise contribution to both Master PCs arriving from each of the 12 disorder-specific PC traits.

