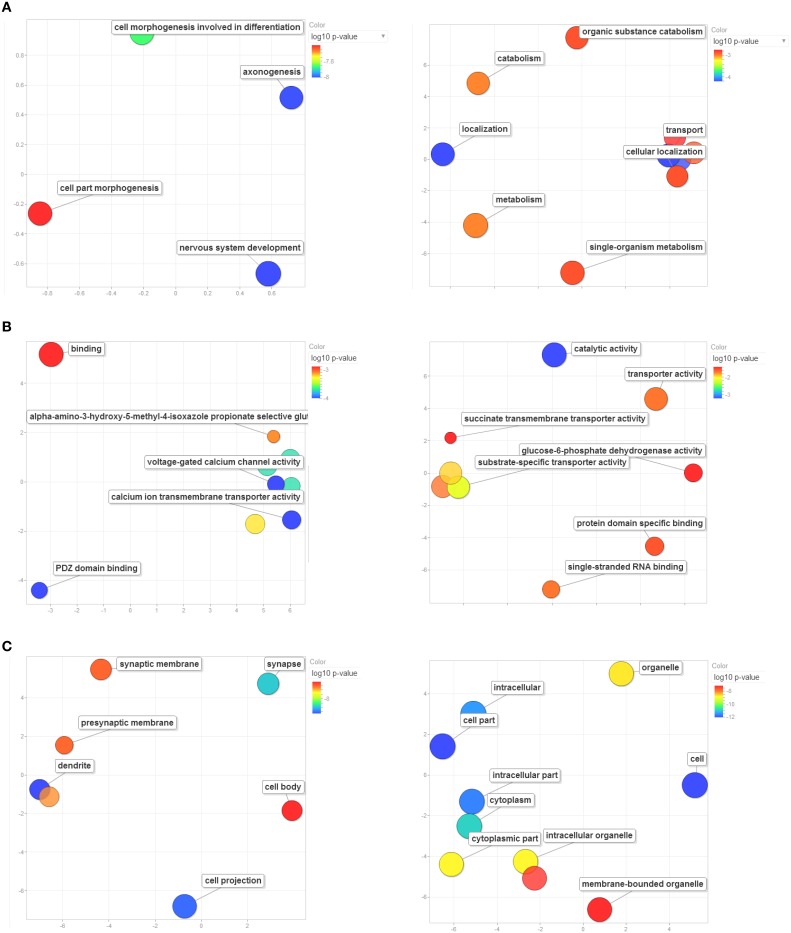
Figure 7.
Enrichment analysis based on GO terms for Master PC1's (left column) and Master PC2's (right column) top-500 correlated gene set. Significant enrichment of genes included in GO terms relevant to (A) biological processes, (B) molecular functions, and (C) cellular components. Only significantly enriched GO categories are depicted. Bubbles are color-coded according to the adjusted log10 p-value of the top-correlated genes enrichment relative to the whole mouse genome. Blue and green bubbles are GO terms with more significant p-values than the orange and red bubbles. The bubbles' x and y coordinates were derived by applying multidimensional scaling to a matrix of the GO terms' semantic similarities; consequently, their closeness on the plot should closely reflect their closeness in the GO graph structure i.e. the semantic similarity. GO terms are based on the Gene Ontology Consortium available at: http://www.geneontology.org/. GO enrichment analysis was performed using WebGestalt: an integrated system for exploring gene sets in various biological contexts (Zhang et al., 2005), available at: http://bioinfo.vanderbilt.edu/webgestalt/.

