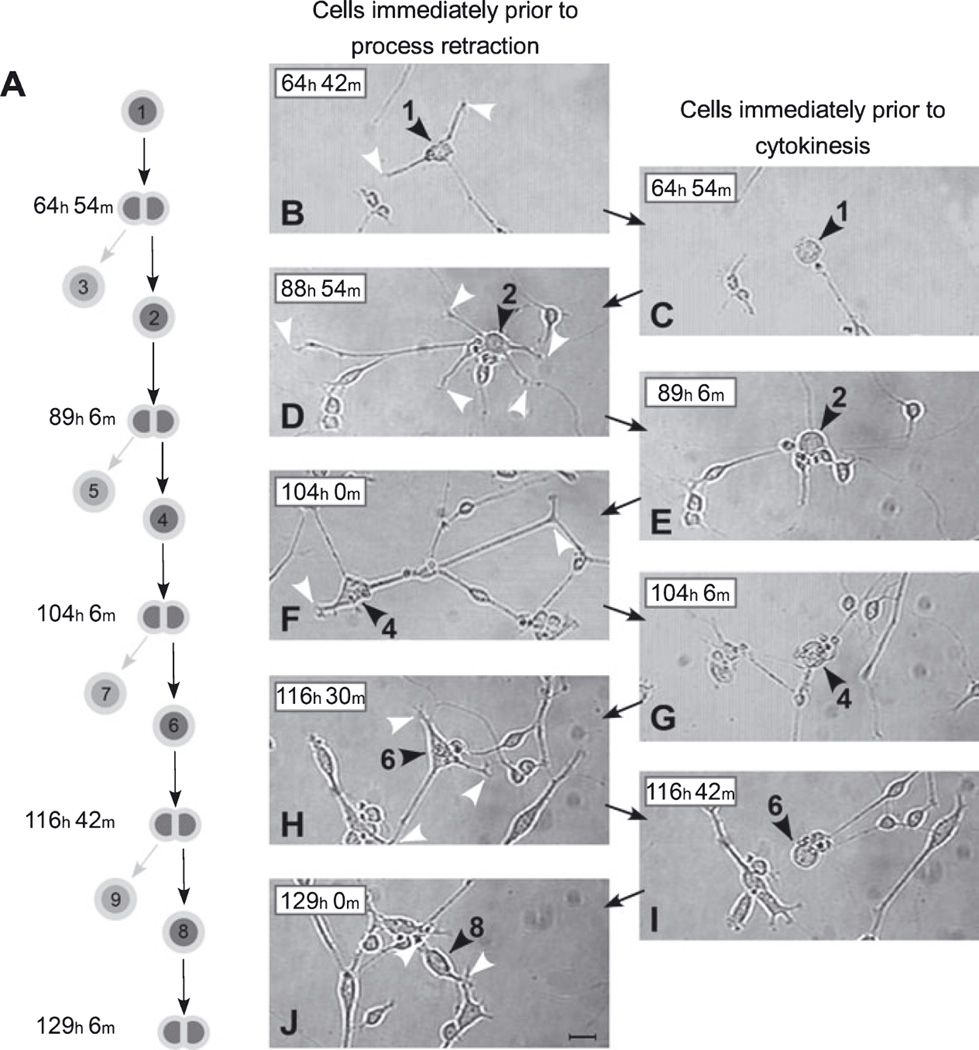
Fig. 7.
Process retraction precedes each division of lineally related SVZa progenitors in a clone. (A) Lineage relationships for cells illustrated in photomicrographs B–J. These cells are representative members of the lineage depicted in Fig. 6. Only one daughter produced by each cytokinesis, those numbered 2, 4, 6 and 8, is illustrated in the photomicrographs. The daughter cells pointed to by the light arrows in A, those numbered 3, 5, 7 and 9, are not tracked in these images. (B–J) The left column of photomicrographs (B, D, F, H and J) shows images of cells immediately prior to their initiation of process retraction. The right column of photomicrographs (C, E, G and I) shows images of cells immediately prior to their cytokinesis. The position of the soma (black arrowheads) and process tips (white arrowheads) of the relevant cells are indicated. The sequence in photomicrographs G–I, for example, shows the following. (G) Cell no. 4 at 104 h 6 min after plating with its processes fully retracted and on the verge of dividing to give rise to Cell nos 6 and 7 (see lineage diagram in A). (H) Cell no. 6, one of cell no. 4’s daughters, 12 h 24 min after its birth and immediately prior to initiating rapid process retraction. At this time it has three processes (white arrowheads). (I) Cell no. 6 immediately prior to its cytokinesis to give rise to Cell nos 8 and 9. This image was collected just 12 min after the image in H. Together, photomicrographs B–I demonstrate the repeated extension and full retraction of elaborate processes over multiple generations of a single lineage of SVZa neuronal progenitor cells. Scale bar, 20 µm in J (applies to all panels).

