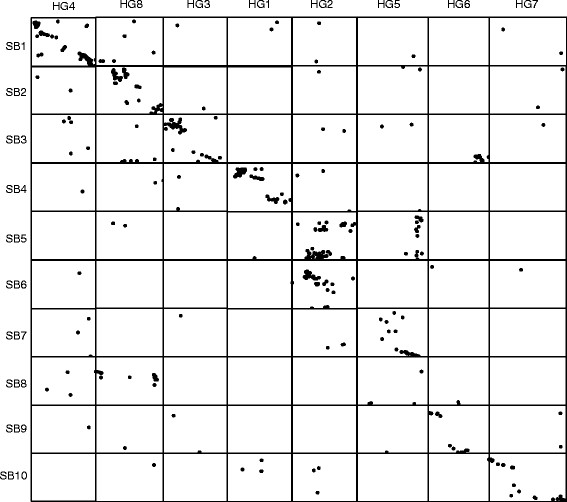
Figure 1.

Global distribution of synteny between the 10 sorghum chromosome sequence (SB1-10) and the 8 composite linkage groups fromSaccharumcultivar Q165. Loci showing homology between the two genomes at P < 1e−20 significance threshold are indicated by dots.
