
Figure 2.
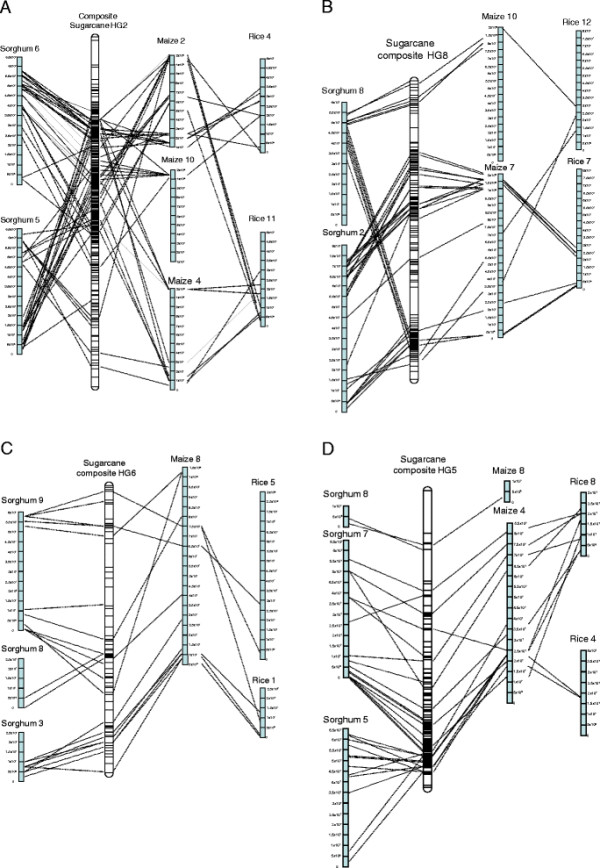
Alignment of the composite sugarcane LGs to sorghum, maize and rice genomic sequences (A-D). The bars on the sugarcane LG represent markers from Additional file 1. These are aligned using the BLASTN algorithm (P < e−20) and the position indicated by lines to the other chromosomes. The scale of the chromosomes is in bp.