
. 2014 Jul 26;14:190. doi: 10.1186/s12870-014-0190-x
Copyright © 2014 Aitken et al.
This is an Open Access article distributed under the terms of the Creative Commons Attribution License (http://creativecommons.org/licenses/by/4.0), which permits unrestricted use, distribution, and reproduction in any medium, provided the original work is properly credited. The Creative Commons Public Domain Dedication waiver (http://creativecommons.org/publicdomain/zero/1.0/) applies to the data made available in this article, unless otherwise stated.
Figure 3.
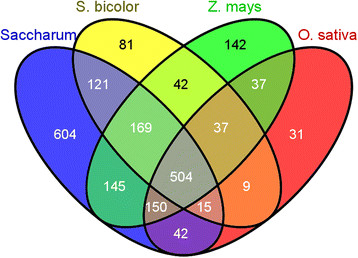
Venn diagram of DArTs with hits against the EST datasets from four species.