
Figure 1.
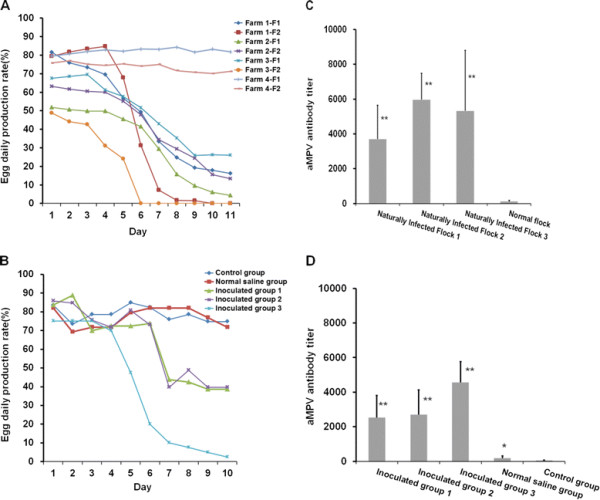
Daily egg production rate and the aMPV antibody levels of naturally infected and inoculated ducks. Daily egg production rate represented by different flocks from three infected duck farms (A-Farm 1-F1&F2, Farm 2-F1&F2, Farm 3-F1&F2), two normal flocks from Farm 4 were used as the control (A-Farm 4-F1&F2). aMPV-antibody titer represented by three groups of ducks naturally infected and recovered (B - Naturally infected Flock 1, 2, 3), ducks in the normal flocks were used as the control (B - Normal Flock). S-01 was used to reproduce the disease. Ducks in group 1, 2 and 3 were inoculated with F1-, F5-, F10-embryo-passaged S-01 virus, respectively. Daily egg production rate (C) and aMPV antibody titer (D) are represented by three infected-duck groups and two control groups (Normal saline group, Control group). Statistical significance for an effect upon aMPV-C infection was determined using the Student’s t-test. Asterisks indicate statistical differences between control and aMPV-C groups (**P < 0.01; *P > 0.05).