
Figure 2.
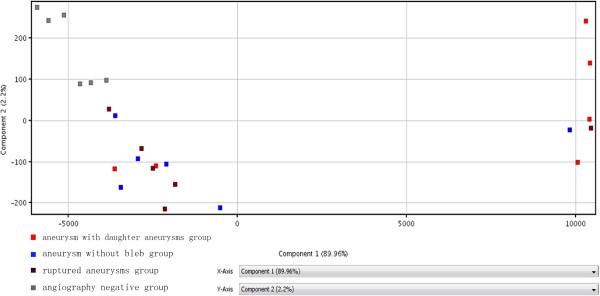
Results of the analysis of PCA. Red: aneurysms with daughter aneurysms group; Blue: aneurysm without bleb group; Dark: ruptured aneurysms group; Gray: angiography negative group. X-axis and Y-axis respectively stand for component 1 and 2. Small squares of the same color represent patients from the same group and have similar proportions in two components. The distribution of small squares illustrates that miRNA expression levels are different between different teams.