
Figure 3.
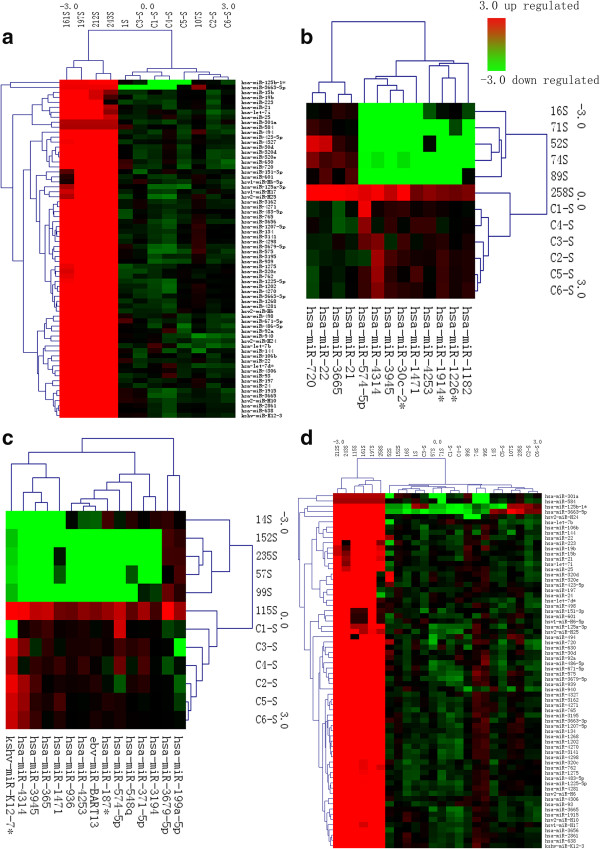
Result of cluster analyses. (a), (b), (c) and (d) respectively stands for differential expression results of miRNA: A vs control group, B vs control group, C vs control group and A+B+C vs control group. Red stands for up-regulated and green stands for down-regulated. C1-C6 stands for patients of control group. 197S, 212S, 243S, 161S, 1S and 107S stand for 6 patients in Group A. 16S, 52S, 258S, 74S, 71S and 89S stand for 6 patients in Group B. 115S, 152S, 235S, 57S, 99S and 14S stand for 6 patients in group C. As is revealed in the figure, miRNA expression levels are obviously different between different groups.