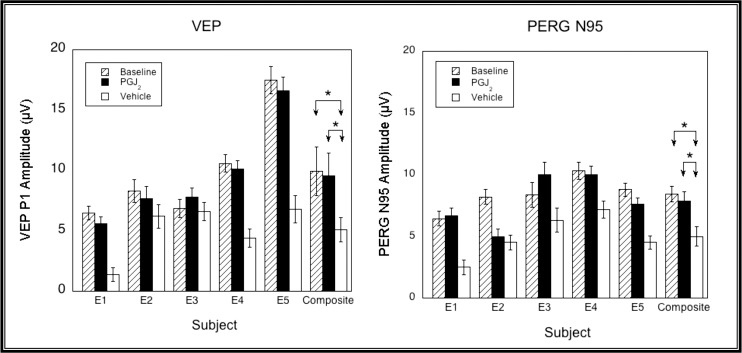
Figure 5.

VEP (left) and PERG N95 (right) amplitudes measured at baseline (hatched bars), and 1 month post pNAION and injection with either PGJ2 (black bars) or vehicle (white bars). Error bars are ±1.96 SE. VEP amplitudes were significantly higher in three of five eyes (E1, E4, and E5) injected with PGJ2 compared with vehicle. PERG N95 amplitudes were significantly higher in three of five eyes (E1, E3, and E5) injected with PGJ2 compared with vehicle. Neither VEP nor PERG N95 amplitudes were significantly different from baseline in the PGJ2-treated eye of any animal or for the group as a whole (for both VEP and PERG, vehicle versus baseline: P = 0.03; PGJ2 versus baseline: P = 0.44; PGJ2 versus vehicle, P = 0.03, Wilcoxon Rank Sum Test).
