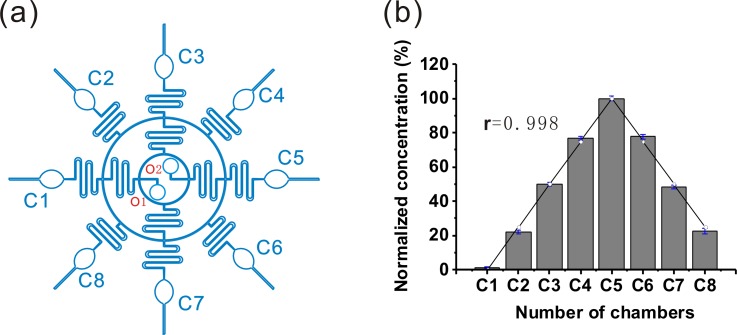
FIG. 4.
Microfluidic chemical concentration gradient generation (CGG) in a single device for on-chip toxicity assessment and rescue assay. (a) The construction of CGG in the device. O1 and O2 indicate the two central chemicals inlets. Cn means the nth chamber (1 ≤ n ≤ 8). (b) Quantitative comparison of the formed chemical concentrations in the terminal chambers between the actual and estimated (○) experiments. The actual concentration was inferred from fluorescence intensity of FITC in the eight chambers. The correlation coefficient between the experimental data and theoretic prediction is 0.998.

