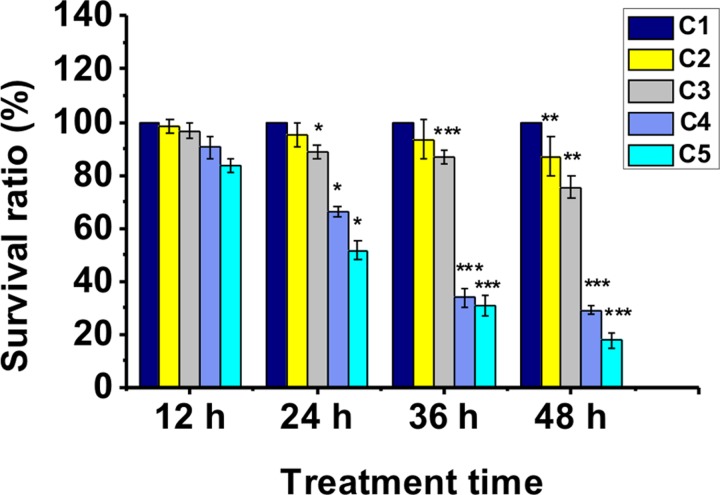
FIG. 6.
The survival rates of the worms (N2) in the chamber 1–5 after exposure to MnCl2 (the largest concentration of MnCl2 in chamber 5 can achieve about 100 mM). The asterisks indicate a statistically significant difference from the control group (chamber 1, *P < 0.05, **P < 0.01, and ***P < 0.001). 20–24 worms used in each assay, 48 h of exposure time and 3 independent assays under each condition. Error bars denote the SD.

