
Table 2.
Mean (± SE) developmental time (d), range of variation, and coefficient of variation of immature stages of B. carambolae and B. papayae at six constant temperatures (n=5 replicates, repeated three times).
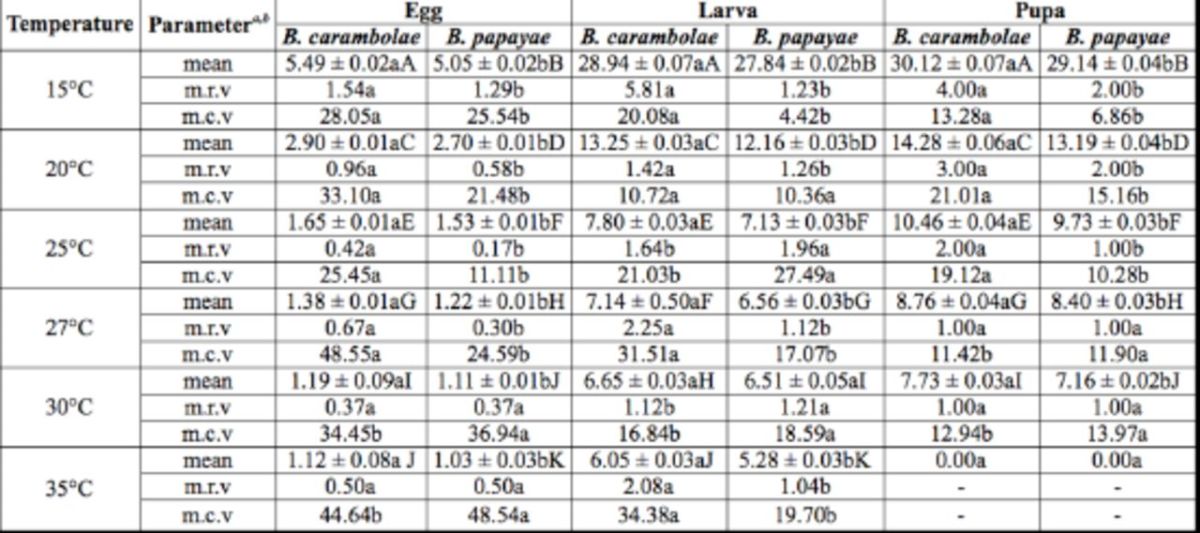
Means followed by different lowercase letters in the same row for a specific stage at each temperature are significantly different between the two species ( P < 0.05; t -test), and means of developmental time followed by different capital letters in the columns and rows for each specific stage are significantly different ( P < 0.05; ANOVA).
a m.r.v, mean range of variation (r.v. = maximum developmental time – minimum developmental time).
b m.c.v, mean coefficient of variation (c.v. = [100 < r.v.] / developmental time).