
Table 3.
Mean (± SE) percentage of survival of immature stages of B. carambolae and B. papayae at six constant temperatures.
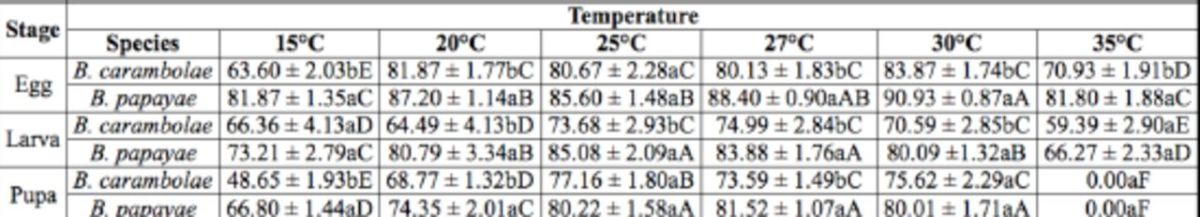
Means followed by different lowercase letters in the same column for each specific stage at each temperature are significantly different between the two species ( P < 0.05; t -test), and means followed by different capital letters in the same columns and rows for each specific stage are significantly different ( P < 0.05; ANOVA).