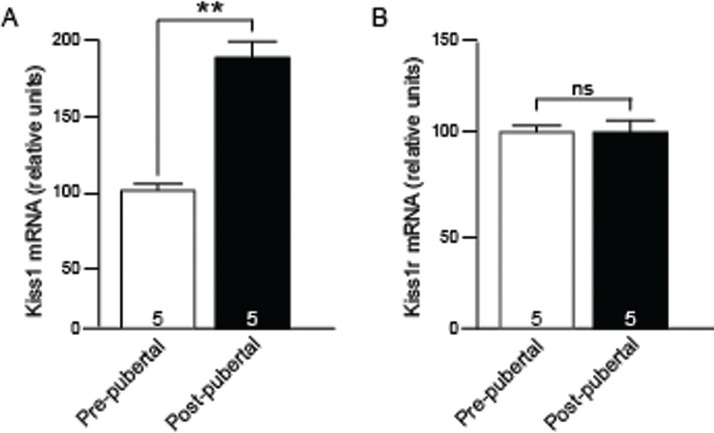
Figure 3.
Kiss1 and Kiss1r mRNA expression before and after puberty. Bar graphs showing the fold-change, relative to pre-puberty levels, in gene expression for Kiss1 (A) and Kiss1r (B) before (white bars) and after (black bars) puberty. Numbers at base of bars indicate number of brains assayed. *, P < 0.05, Students t-test.

