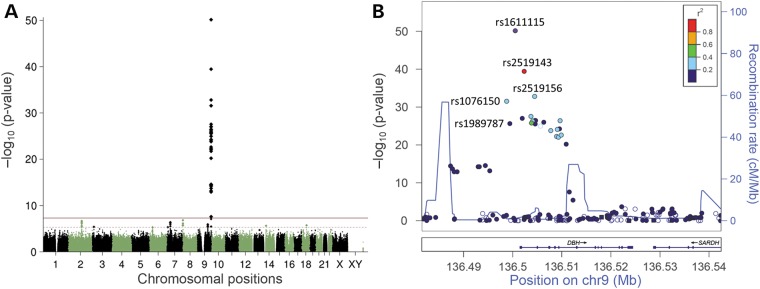
Figure 1.

Results of the GWAS of plasma DBH activity in 341 subjects of European origin. (A) Manhattan plot showing the −log10 (P-values) for SNP associations with plasma DBH activity across the genome. The red horizontal line represents the genome-wide significance threshold at P < 5 × 10⁻⁸ and the dashed line represents suggestive evidence for association at P < 5 × 10⁻⁶. (B) Regional association plot, showing significant regions in DBH on chromosome 9. Directly genotyped SNPs are indicated by an asterisk (*). The SNPs are color coded based on the linkage disequilibrium with the most significant SNP rs1611115.
