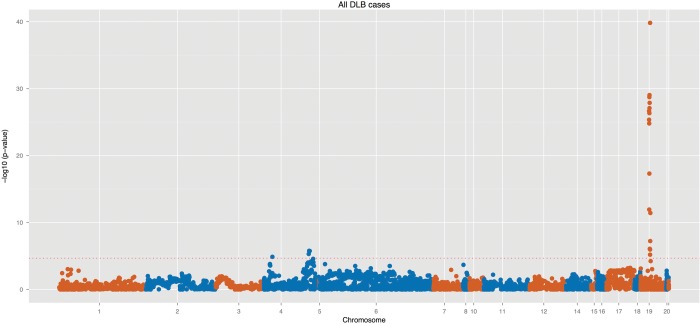
Figure 1.
Genomic overview of the association at 54 genomic regions in a cohort of 788 DLB cases and 2624 controls. These loci correspond to 500 kb flanking regions of each top association hit from the latest PD and AD GWAS (32 regions from PD and 22 from AD GWAS). The dotted horizontal red line represents our study-wise Bonferroni correction threshold of 3.7 × 10⁻⁵.

