Figure 5.
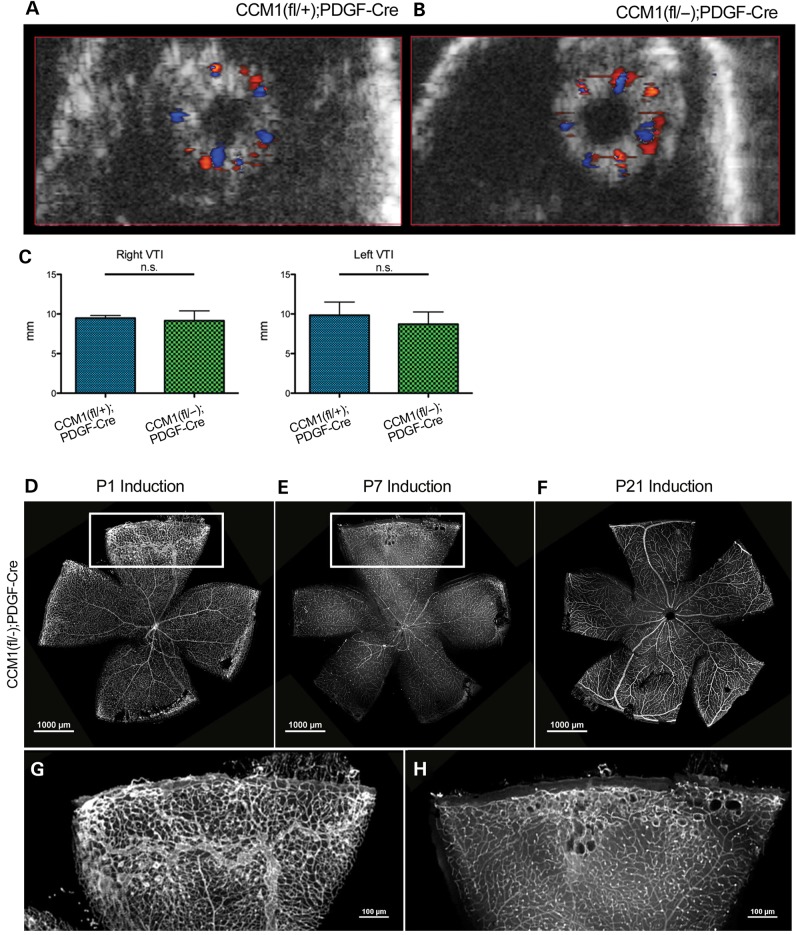
Retinal CCMs do not exhibit disrupted hemodynamics and are limited to a specific developmental window. (A and B) Ultrasound images of whole retinal vasculature from either control or knockout mice, orientation is en face with the optic nerve in the center of the eye. Red color indicates blood flow towards the camera, blue color indicates blood flow away from the camera. (C) Quantification of the volume time interval (VTI) of both left and right eyes as calculated by the Vevo2100 software. (D–F) Visualization of the retinal vasculature, as indicated by lectin stain, from a CCM1 knockout mouse that was induced at P1 (D imaged at P21), induced at P7 (E imaged at P21) or induced P21 (F imaged at 8 months). (G and H) Close-up of the vascular lesion from the insets in E and F. Scale bars set at 1000 μm.

