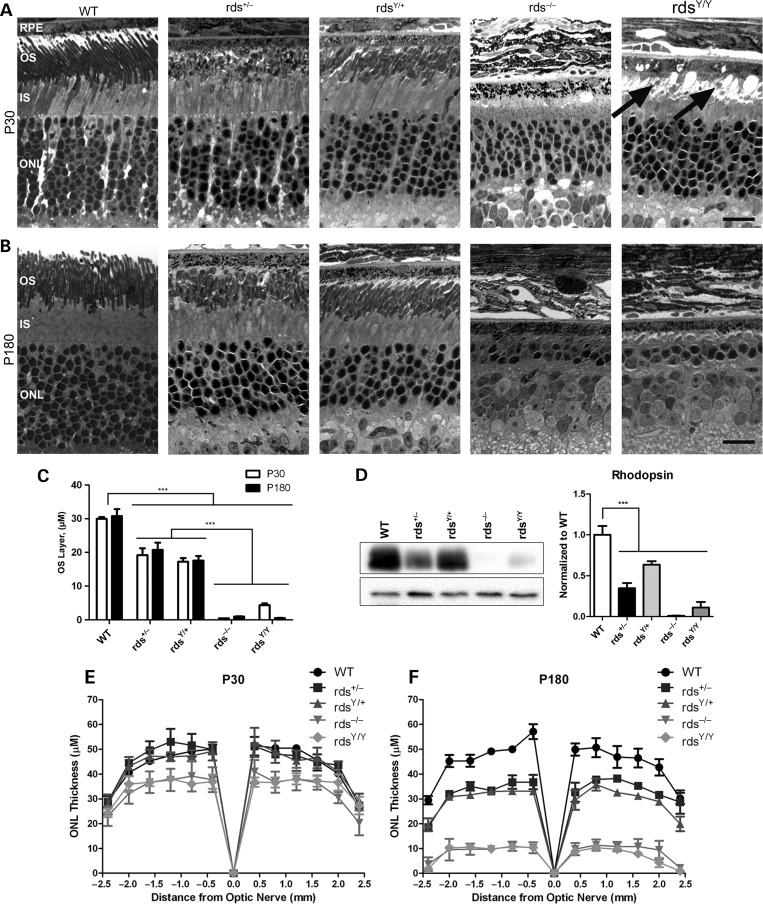
Figure 4.
Expression of Y141C-RDS leads to photoreceptor degeneration. Representative light microscopic images from retinal sections at P30 (A) and P180 (B) are shown. OS length was quantified and plotted as mean ± SEM (C). Rhodopsin protein levels were assessed by WB and quantified. (D) ONL thickness was assessed in central retinal sections at increasing distances from the optic nerve head at P30 (E) and P180 (F). Plotted are means ± SEM from N = 3 eyes/genotype/age. RPE, retinal pigment epithelium; OS, outer segments; IS, inner segment; ONL, outer nuclear layer. Scale bars: 5 µm.

