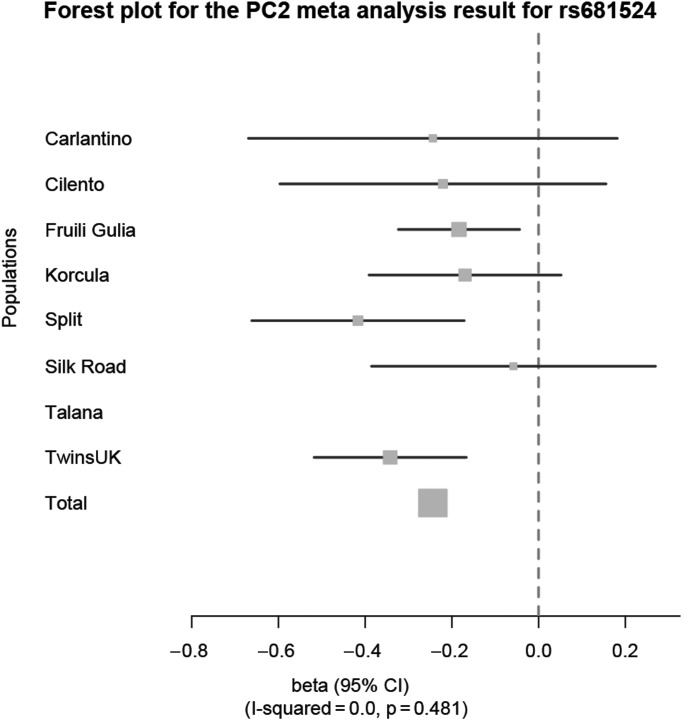
Figure 2.
Forest plot for the PC2 meta-analysis result for rs681524 in SIK3. The forest plot shows the effect sizes (beta with 95% CI) at rs681524 on PC2 for each population in comparison with a combined meta-analysis effect (total). A consistent negative effect for the minor C allele at rs681524 for all European populations could be determined. The percentage of variation owing to heterogeneity across populations was not significant (I2 = 0.0, P = 0.481). Corresponding data are listed in Table 5.

