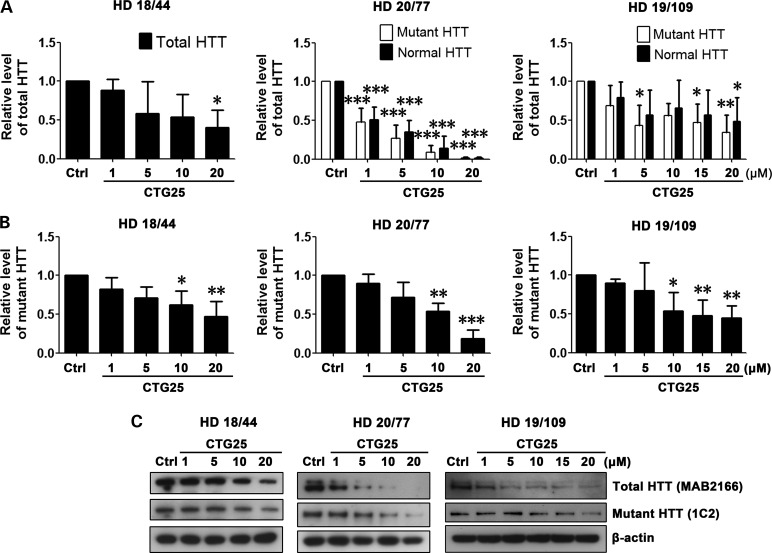
Figure 2.
PMO CTG25 inhibits HTT expression. Cell lines HD 18/44, HD 20/77 and HD 19/109 were each treated for 48 h with 1, 5, 10 and 20 µm CTG25 or 20 µm standard control PMO (Ctrl). (A) Analysis of total HTT levels after CTG25 treatment. Antibody MAB2166 was used to discriminate between normal HTT (lower band) and mutant HTT (upper band) in cell lines HD 20/77 and HD 19/109. Since it is not possible to resolve normal and mutant HTT in the HD 18/44 cell line, total protein levels were analyzed. HD 18/44, one-way ANOVA, F = 2.960, P = 0.0747, n = 3; HD 20/77, two-way ANOVA, F(Allele) = 0.51, P(Allele) = 0.4821, F(PMO) = 63.07, P(PMO) < 0.0001, n = 3; HD 19/109, two-way ANOVA, F(Allele) = 1.35, P(Allele) = 0.2571, F(PMO) = 4.38, P(PMO) = 0.0057, n = 3; post hoc test *P < 0.05, **P < 0.01, ***P < 0.001 versus Ctrl PMO–treated group. (B) In addition, 1C2 immunoblotting was performed to assess mutant HTT level only. All HD cell lines, one-way ANOVA, n = 3. HD 18/44, F = 5.237, P = 0.0154; HD 20/77, F = 21.56, P < 0.0001; HD 19/109, F = 5.210, P = 0.0039; post hoc test *P < 0.05, **P < 0.01, ***P < 0.001 versus Ctrl PMO–treated group. (C) Representative western blot data. HTT antibodies are shown in parentheses. All experiments were performed three times.

