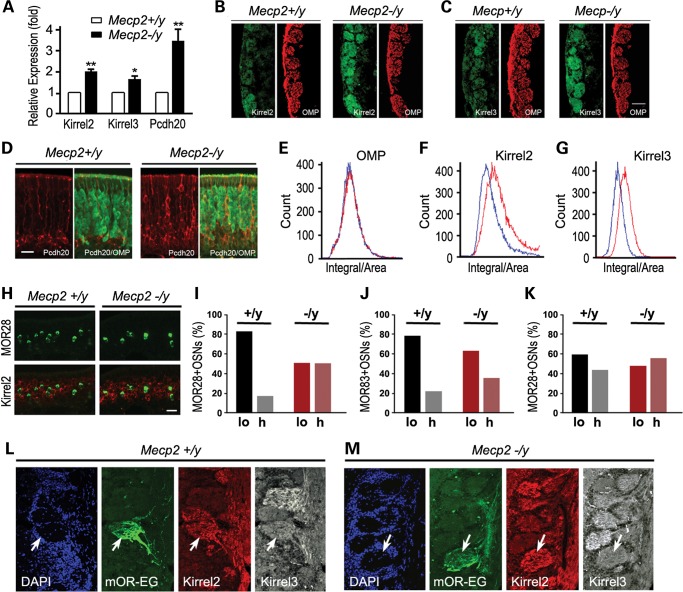
Figure 2.
Mecp2 suppresses Kirrel2, Kirrel3 and Pcdh20 expression. (A) Relative transcript levels of Kirrel2, Kirrel3 and Pcdh20 in Mecp2−/y OE to wild type. (B) Kirrel2 IF signals (green) in Mecp2−/y (right panel) and wild-type OB (left panel). OMP (red) signal outlines the location of the glomerular layer. (C) Kirrel3 IF signals (green) in Mecp2−/y glomeruli (right panel) compared with Mecp2+/y control (right panel). (D) Pcdh20 expression (red) in the MOE localizes to OSNs below the OMP-positive (green) OSN layer in the Mecp2+/y control OB (left panel) while in Mecp2−/y mice, Pcdh20-positive OSNs (red) also appear in the OMP cell layers (right panel). (E) OMP signal levels are similar between wild-type control (blue line) and Mecp2−/y (red line) within the OB glomeruli. (F, G) Kirrel2 (F) and Kirrel3 (G) signal levels (red lines) in Mecp2−/y glomeruli increase significantly compared with wild-type control levels (blue lines)) (t-test: P < 1e−30). (H) Double in situ hybridization for Kirrel2 expression (red) and MOR28-positive (green) OSNs in wild-type control Mecp2+/y (left panel) and Mecp2−/y OB (right panel). (I) 83.5% of MOR28-positive OSNs in wild-type OE (left panel) have low levels of Kirrel2 expression (lo) and 16.5% had high levels of Kirrel2 (hi while in Mecp2−/y OE, MOR28-positive OSNs roughly equal proportions of Kirrel2 low and high populations were detected (50%) in OE. n = 200. (J) Kirrel3 expression is low in 78.8% of MOR83-positive OSNs in wild-type control versus 64.2% in Mecp2−/y OE. (K) 42.3% of MOR28-positive neurons express Pcdh20 in wild-type control OE versus 53.8% in Mecp2−/y, n = 100 for (I)–(K). (L, M) mOR-EG glomeruli are shown in mOR-EG-IRES-tauGFP OB (green). Kirrel2 and Kirrel3 immunoreactivity levels are visualized in both wild-type control (left panel) and Mecp2−/y OB (right panel). Scale bars = 100 µm in (B), (C), (L) and (M); 35 µm in (D) and (H). Student's t-test *P < 0.01, **P < 0.001.

