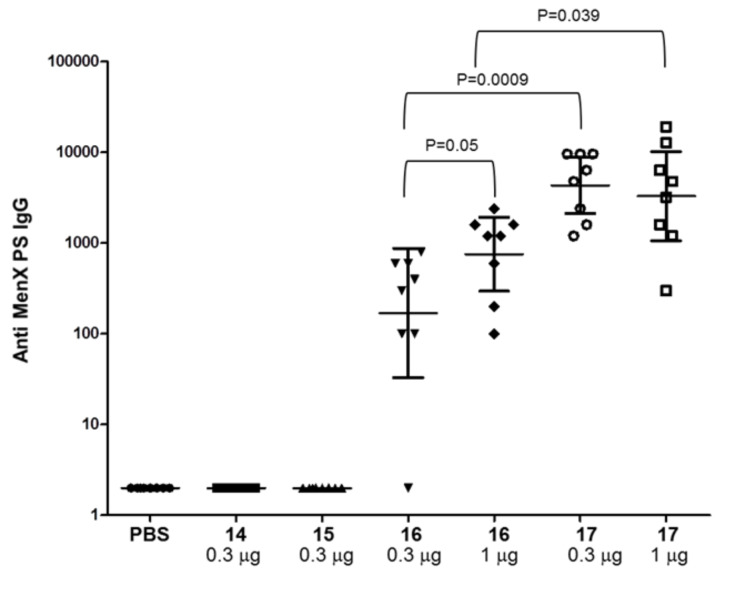
Figure 2.
IgG levels detected at OD = 1 in individual post 3 sera (sera collected two weeks after the third immunization) of BALB/c mice immunization at 0.3 or 1 μg saccharide dose of antigen against MenX CPS as coating plate. Each dot represents individual mouse sera; horizontal bars indicate geometric mean titers (GMT) of each group with 95% statistical confidence intervals indicated by upper and lower bars.

