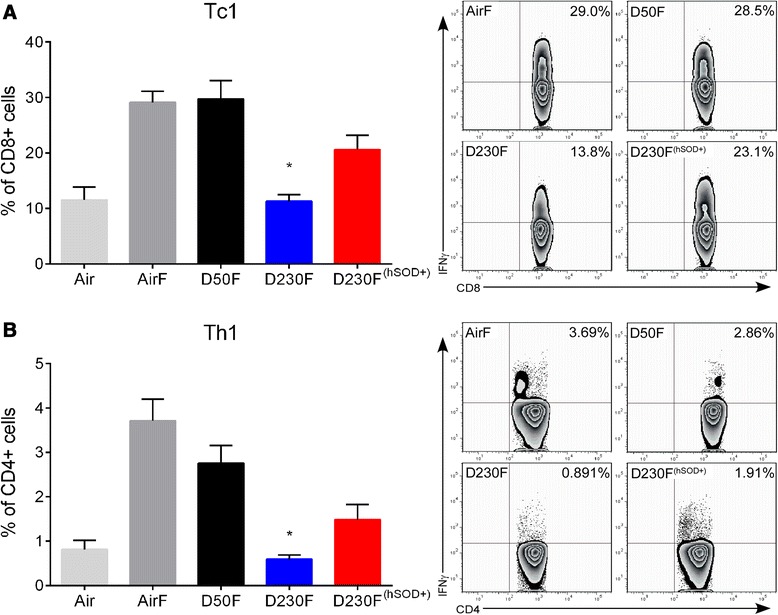
Figure 3.

Effect of EPFR exposure on adaptive immune response (Tc1 and Th1) to influenza infection in neonates. Neonatal mice were exposed to air, DCB50, or DCB230 and infected i.n. with influenza (AirF, D50F, D230F, D230F(hSOD+)) or sham infected with DPBS (Air). Lung effector T cell profiles were determined by flow cytometry at six dpi. (A) Percentage of CD8+ cells expressing IFNγ (Tc1) with representative flow contour plots demonstrating outliers. N = 3-12/group. (B) Percentage of CD4+ cells expressing IFNγ (Th1) with representative flow contour plots demonstrating outliers. N = 3-12/group. Data plotted as mean ± SEM. *p <0.05 D230F vs AirF, D50F, and D230F(hSOD+); multiple t tests with Holm-Sidak correction for multiple comparisons.
