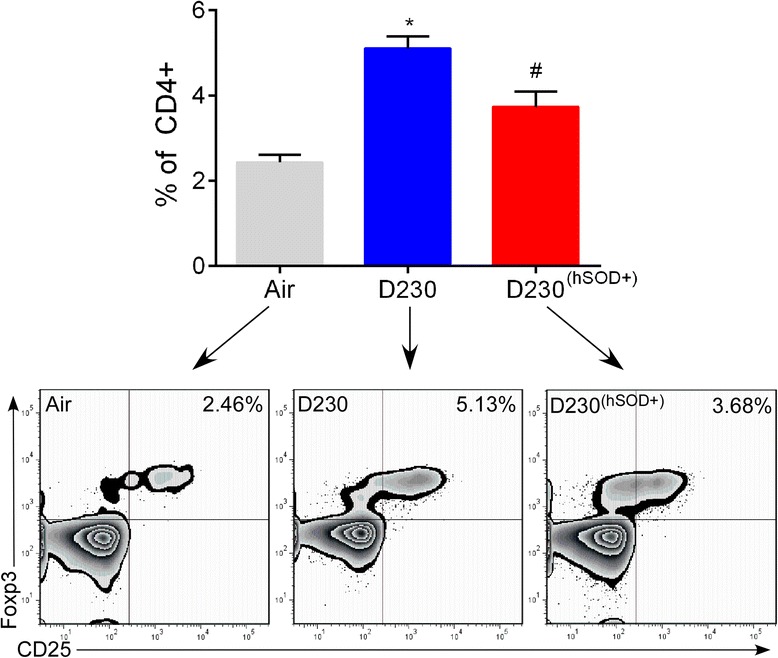
Figure 4.

Effect of EPFR exposure on pulmonary regulatory T cells (Tregs). Neonatal mice were exposed to air or DCB230 (Air, D230, D230(hSOD+)) for five consecutive days and lungs were isolated four dpe (at the time infection would have occurred). Pulmonary Tregs were identified and quantified by flow cytometry. N =6-8/group. Data plotted as mean ± SEM with representative flow contour plots with outliers. *p <0.05 D230 vs Air and D230(hSOD+), # p <0.05 D230(hSOD+) vs Air and D230; one-way ANOVA with Tukey’s multiple comparisons test.
