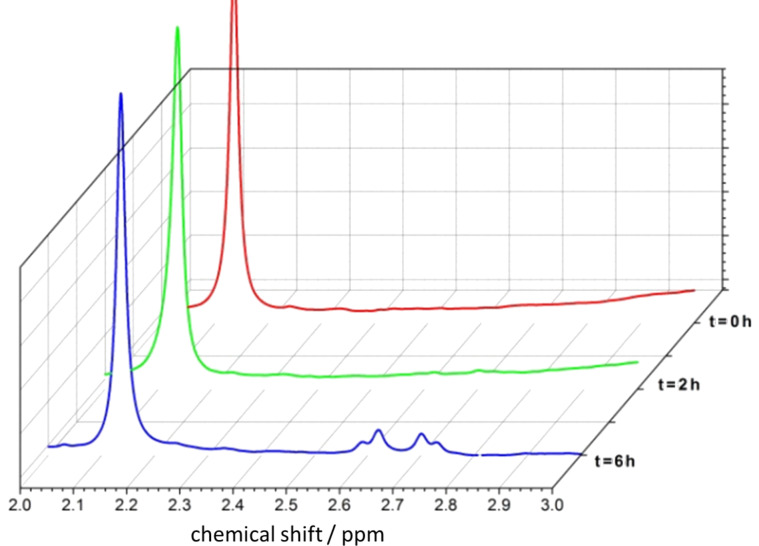
Figure 4.
1H NMR spectra recorded at t = 0, after 2 and 6 h of irradiation in water. The selected range, 2–3 ppm, is diagnostic for NADH H-signals. The signal at 2.1 ppm results from the ribose hydrogen in the cofactor molecule and is taken as a reference peak. The concentration of the rhodium complex is 0.5 mM, with cglycerol = 0.05 M.

