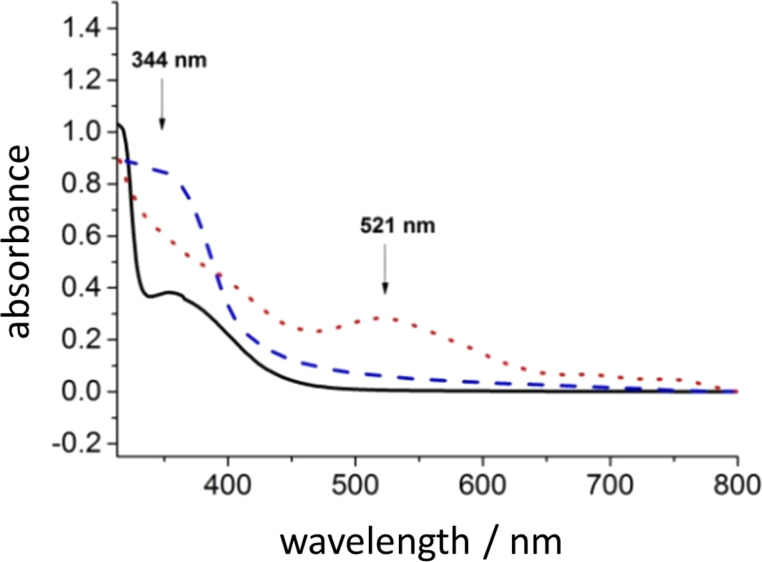
Figure 8.
UV–vis absorption spectra of an aqueous solution of [Cp*Rh(bpy)(H2O)]2+. Continuous black line: spectrum of the starting rhodium complex in water. Dotted red line: spectrum of the rhodium complex after treatment with hydrogen. Dashed blue line: spectrum of the rhodium-hydrido complex after addition of NAD+: the band at 521 nm disappears and the band at 344 nm attributed to NADH appears.

