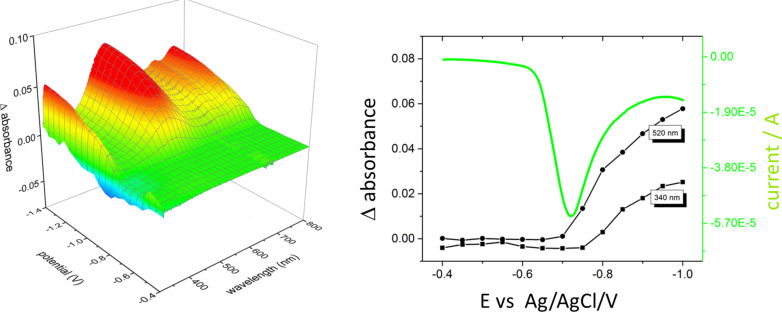
Figure 9.
Spectral changes of the [Cp*Rh(bpy)(H2O)]2+ solution as a function of the applied potential (left). Cyclic voltammogram and corresponding changes in absorbance recorded at 521 nm (right). For simplicity, only the part of the potential scan (the reduction process from −0.4 to −1.4 V and back) is shown.

