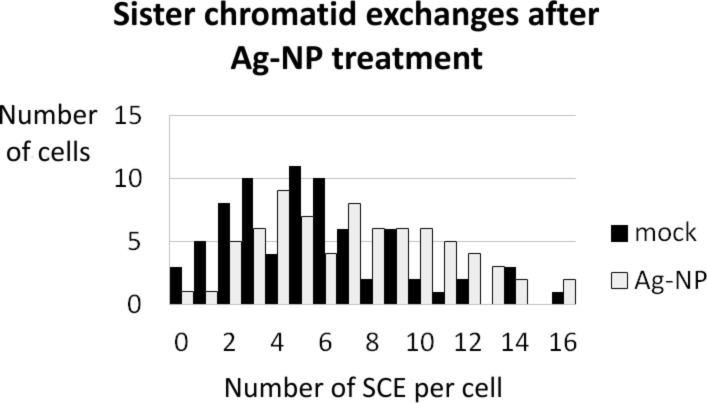
Figure 13.
The diagram shows the distribution of sister-chromatid exchanges (SCE) in untreated cells (black bars) and silver nanoparticle treated cells (grey bars). The average number of SCE per cell increased from 5.50 in untreated cells to 7.26 in silver nanoparticle-treated cells. This shift of the average number of SCE was significant (p = 0.998) when using a single-sided unpaired t-test. In total there were 407 SCE scored in 74 untreated cells and 537 SCE in 75 silver nanoparticle-treated cells.

