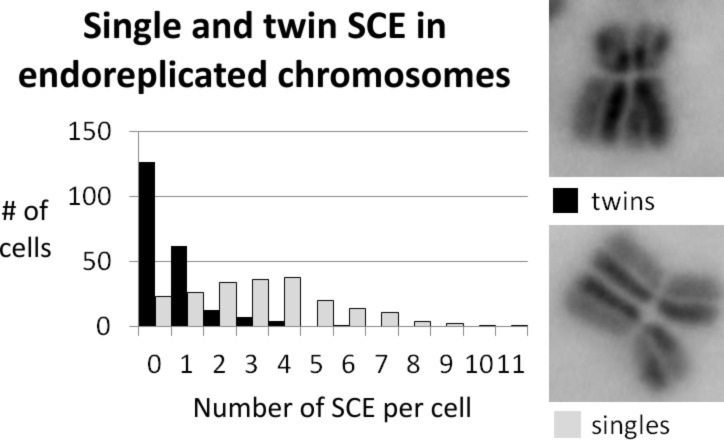
Figure 15.
The diagram shows the distribution of twin SCE (black bars) and single SCE (grey bars) in CHO K1 cells, treated with silver nanoparticles. The average number of SCE per cell changes from µ = 0.612 for twin SCE (n = 214) to 3.115 for single SCE (n = 208; p > 0.999). Images on the right side show examples for twin SCE and single SCE.

