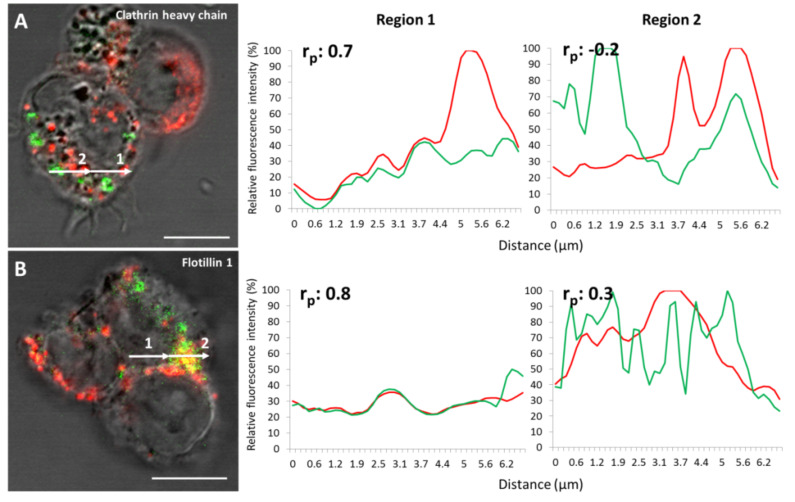
Figure 4.
Fluorescence intensity profiles of J774A.1 cells, 40 nm PS NPs with clathrin heavy chain or flotillin-1. (A) and (B) are confocal images of J774A.1 cells treated with 40 nm PS NPs (red) and primary antibodies against uptake proteins (green), respectively. The corresponding relative fluorescence profiles of the overlapping signals are shown in the diagrams to the right (regions 1 and 2). Cells are shown in the transmission light channel. The Pearson coefficient (rp) was calculated for each of the regions. (A) 40 nm PS NPs and clathrin heavy chain, (B) 40 nm PS NPs and flotillin-1. The white arrows are 6.8 µm in length. Scale bar = 10 µm.

