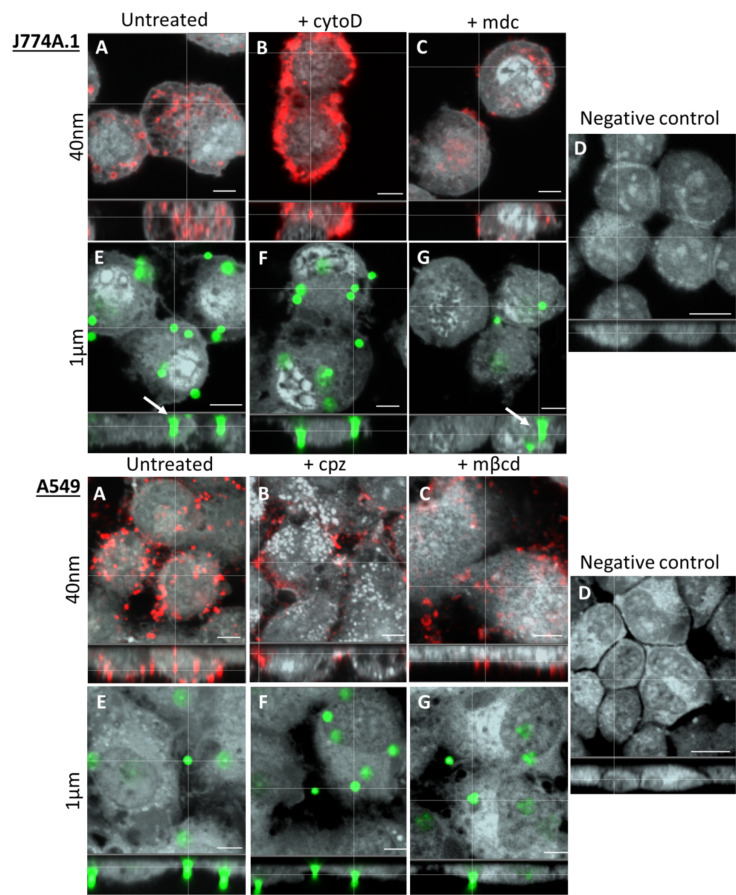
Figure 5.
Laser scanning microscopy imaging revealed particle uptake in J774A.1 and A549 cells. (A–C) Uptake of 40 nm PS NPs (NP: red, cytosol: grey). (A) Untreated cells with 40 nm NPs. (B) 40 nm NPs and cytochalasin D (cytoD) in J774A.1 and chlorpromazine (cpz) in A549 cells. (C) 40 nm NPs and monodansylcadaverine (mdc) in J774A.1 cells and methyl-β-cyclodextrin (mβcd) in A549 cells. (D) Negative control. (E–G) Uptake of 1 µm PS particles (particles: green, cytosol: grey). (E) Untreated cells with 1 µm particles. (F–G) 1 µm particles with the same adequate inhibitors. Scale bar: 5 µm. White arrows represent intracellular events of 1 µm particles in J774A.1 cells. The negative controls have a scale bar of 10 µm.

